Article Highlights:
- As we are now approaching six months since the administration’s “Liberation Day” tariffs were initially announced, it’s worth examining the data to understand how trade patterns have shifted, if at all, as a result of these new tariff programs.
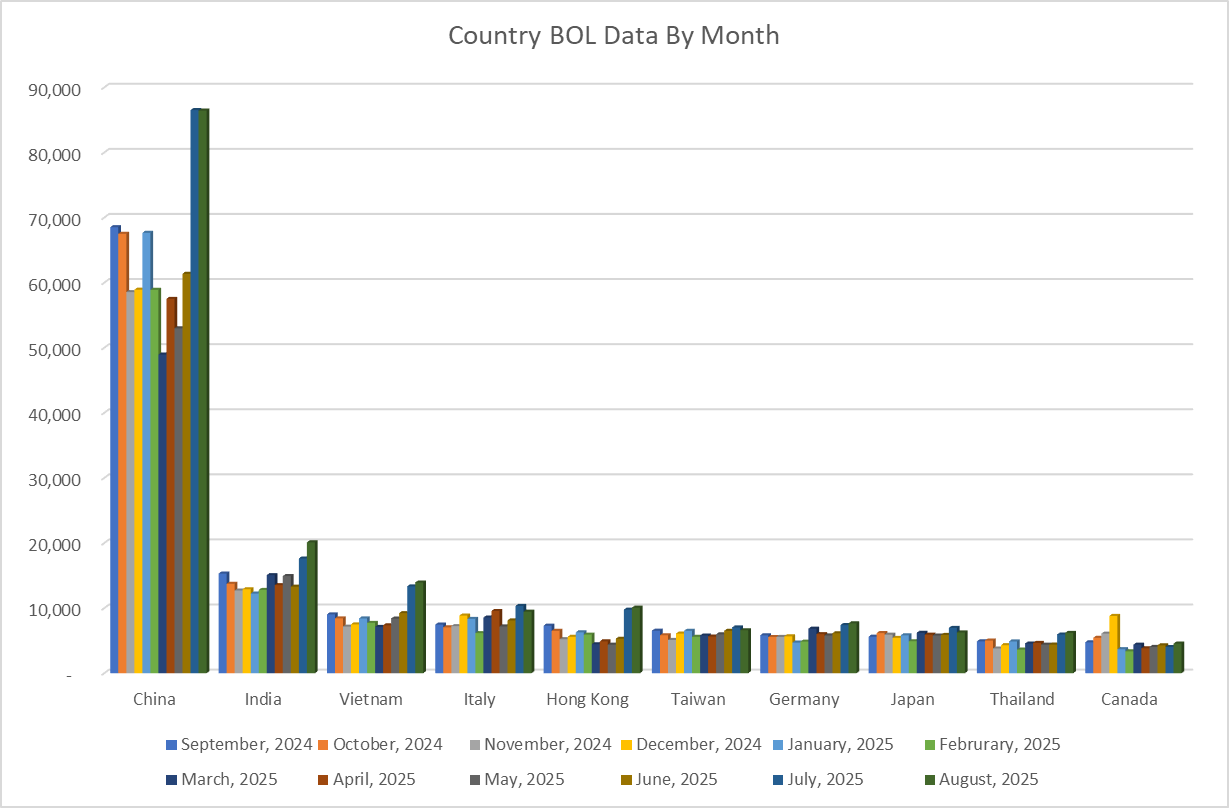
- In this Z2Data analysis, we pulled just over 12 months of U.S. sea shipment import data in the form of bills of lading (BoLs) beginning in September 2024 and going through the first portion of September 2025. Data was organized by month and origin country.
- Our findings are summarized in four key insights, including takeaways about U.S. imports from China, Vietnam, Brazil, and Indonesia, among other nations.
A New Tariff Regime
Since taking office in early 2025, President Trump has taken action on many of the promises he made on the campaign trail regarding tariffs by instituting a sweeping new US trade regime. While some aspects of his tariffs remain threatened by ongoing litigation, many of the programs his administration has launched have already had tangible impacts on the way companies do business in the U.S. Among others, the Trump administration has implemented the following import levies:
- Steel and aluminum tariffs via a Section 232 investigation
- New baseline tariffs and duty rates on specific countries under the “Liberation Day” tariff program.
- Expanded tariffs on Canada and Mexico (the so-called “fentanyl tariffs”).
- Specific sectoral tariffs on imports like copper, pharmaceuticals, and semiconductors via executive orders.
Despite many of these tariff programs having a myriad of exceptions, trade agreements, and other factors that attenuate some of their effects, the messaging from the administration to manufacturers has been consistent throughout this term: “The best way to avoid tariffs is to bring manufacturing back to the U.S.”
As we are now approaching six months since the administration’s “Liberation Day” tariffs were initially announced, it’s worth examining the data to understand how trade patterns have shifted, if at all, as a result of these new tariff programs. Supply chain risk management platform (SCRM) Z2Data collects U.S. trade data, which it leverages primarily for relationship information and to build out sub-tier supply chain networks. Here, we’ve drawn on this trade data to provide insights into America’s trading patterns, including the countries where U.S. companies are primarily sourcing from, and whether those nations have shifted significantly in 2025.
Z2Data Analysis Methodology
Z2Data sources U.S. Trade Data from the US Customs and Border Protection’s Automated Manifest System. This system captures all sea manifest transactions, or imports, made on the US Nationwide system each day. There are a few key limitations to this data, including the fact that it only reflects goods shipped to the U.S. by sea, and may be skewed in some places by seasonality. Nevertheless, it can still serve as a meaningful, effective indicator of trends in non-perishable imports into the U.S. This is particularly true of exporting nations and regions, like Europe, South America, and Southeast Asia, that do not have easy, direct land connections to the U.S., and are therefore primarily dependent on maritime shipping.
In this Z2Data analysis, we pulled just over 12 months of U.S. sea shipment import data in the form of bills of lading (BoLs) beginning in September 2024 and going through the first nine days of September 2025. Data was organized by month and origin country. Utilizing this dataset, our analysis was conducted and checked against the timeline of publicly-disclosed U.S. government policy changes, including tariff changes and trade deals, before we arrived at the analysis outlined below.
Timeline of Tariffs and Trade Deals in 2025
President Trump took office in late January 2025 and began instituting many of his new tariff policies beginning in March and April. The main tariff policy that affected ocean shipments to the US was the so-called “Liberation Day” tariffs, which were announced on April 2, 2025. Other programs, including the expanded Section 232 tariffs and the “fentanyl tariffs,” mainly affected Canada and Mexico, which mainly export to the U.S. via land shipments that are not captured in the data.
Also worth noting here is the growing list of bilateral trade agreements brokered by the Trump administration. As of late September, the U.S. has now struck new trade deals with the following countries and blocs:
- UK
- Vietnam
- Indonesia
- Japan
- The Philippines
- The EU
Other countries, including South Korea, have pending deals with the U.S. One noteworthy country that does not have a permanent trade agreement with the U.S. is China. While the U.S. and China have established a temporary agreement to address China’s export restrictions on critical minerals, that deal is set to expire on November 10, 2025.
1. Major Takeaway 1: Despite Volatile Tariff Rates and Looming Threats, U.S. Dependence on China Persists
Based on the 12+ months of bills of lading data we looked at, there has been a relatively stable volume of imports from China this year. There was an initial drop in the three month period between March and May, when many new tariffs were being announced, and the Trump administration temporarily implemented extremely high duties on China.
But records show that volumes recovered relatively quickly, reaching a new monthly high for 2025 in August. In fact, the total U.S. imports from China during that month was nearly 26% higher than the BoL records from September 2024.
This suggests that, despite fears from original equipment manufacturers (OEMs) and other importers about the potential effects of tariffs on global supply chains, many businesses have continued sourcing from China. And with the data from the first third of September 2025 indicating a further uptick in trade volume, it’s clear that China continues to loom very large in American supply chains.
2. Major Takeaway 2: Trade with Brazil Is Expanding Rapidly
Between September 2024 and August 2025, monthly bills of lading between the U.S. and Brazil increased by roughly 100%. This may be attributable to a number of factors. Brazil benefits from a relatively low reciprocal tariff rate of 10%, a favorable currency exchange rate vs the U.S. dollar, and key tariff exemptions in areas like iron ore and agricultural products that make up much of the nation’s exports to the U.S. Because the Section 232 tariffs target steel made specifically in China, Brazil has rapidly emerged as an attractive alternative source for the widely-used metal.
The Trump administration did implement an additional 40% tariff on certain Brazilian imports in August, for what a White House executive order characterized as “actions that interfere with the economy of the United States, infringe the free expression rights of United States persons, violate human rights, and undermine the interest the United States has in protecting its citizens and companies.” It may be too early to detect any impacts stemming from this “free speech tariff,” as it’s being called.
Brazil will remain an intriguing country in the evolving trade landscape, one that may prove instrumental to whatever supply chain restructuring does come to pass in the U.S.
3. Major Takeaway 3: Trade Deals Don’t Guarantee Increase in Imports
The Trump administration has announced trade deals with a raft of countries in recent months, including the UK, Vietnam, Indonesia, Japan, the Philippines, the EU, and South Korea, with additional agreements pending with other nations. However, only Vietnam and South Korea—along with a few individual EU countries—have seen significant changes to import volumes following those trade agreements. While it may be too soon to draw conclusions based on maritime shipping data alone, as of now these trade deals are not strongly correlated with any meaningful increases or decreases in trade.
While it may be too soon to draw conclusions based on maritime shipping data alone, as of now these trade deals are not strongly correlated with any meaningful increases or decreases in trade.
4. Major Takeaway 4: Indonesia Appears All But Immune to Global Tariff Landscape
Much like Brazil, Indonesia has experienced substantial year over year growth in import activity. The country has seen the number of BoL transactions increase 92% between September 2024 and August 2025. While there are no major tariff exemptions to Indonesia’s primary exports to the U.S.—which include palm oil, electronics, apparel, and shoes—it may be the case that the low cost of manufacturing in the country still outweighs, or at least counterbalances, the tariff costs. (The U.S. agreed on a framework to set a tariff rate of 19% on Indonesian goods in July 2025.)
The continued success of Indonesia’s export industries is also evidence of a powerful trend that predates the Trump administration’s tariff regime. Indonesia has been a major beneficiary of China+1 trade practices over the past few years. The chaos, instability, and at times prohibitively high tariff rates on China in 2025 appear to have only accelerated this trend, as U.S. importers are shifting their sourcing to the cheap labor and relative stability offered by Indonesian manufacturers.
Stubborn U.S. Supply Chains Remain Resistant to Trump Tariffs
While the Trump administration has an explicit goal of bringing manufacturing back to the U.S., the new tariff regime it’s implemented appears to have had a minimal impact on trade volumes between the U.S. and many countries thus far. Granted, it’s been less than six months since the Liberation Day announcement of worldwide reciprocal tariffs, and it’s possible that American businesses will eventually decide to start making more significant changes to their sourcing. But as of September 2025, maritime shipping data suggests that U.S. OEMs and other importers are not restructuring their supply chains in a significant or permanent way.
Part of this may be explained by the emergence of a number of new bilateral trade agreements, as well as a range of key exemptions across the US tariff code, which minimize duty rates for certain imports. But U.S. businesses have also been sourcing from countries like China, Vietnam, Indonesia, and parts of the EU for years and sometimes even decades, and overturning that level of entrenchment may be harder than Trump and his administration anticipated.
Regardless of how the Trump administration’s tariff regime evolves from here, U.S. businesses benefit significantly when they leverage supply chain risk management (SCRM) platforms like Z2Data. These tools allow companies to see their direct and sub-tier suppliers with maximum visibility, helping professionals understand their countries of origin (COO), countries of diffusion (COD), and tariff responsibilities.
This data can lead to a number of meaningful strategic actions, including:
- COO adjustments
- Negotiations with suppliers
- Changes to manufacturing sites
- Tariff engineering
To learn more about Z2Data and how it can help your business navigate our dynamic trade landscape, schedule a free trial with one of our product experts.